Improving absolute configuration assignments with vibrational circular dichroism (VCD) by modeling solvation and dimerization effects

Introduction
Stereoisomers of pharmaceutically relevant molecules may have different effects on living organisms. Therefore, knowledge of the absolute stereo-configuration of the synthesized drug is of critical importance. As shown in the FDA guidance, knowledge of the stereochemistry, also referred to as absolute configuration (AC), is required for approved enantiopure therapeutics.1
VCD spectroscopy is a technique that allows one to determine the absolute configuration in solution by comparing experimentally measured and theoretically predicted VCD spectra.2 The VCD spectra of some molecules may show significant variations with the solvent (mainly due to conformational and hydrogenbonding effects). As the choice of the solvent for a VCD measurement may be dictated by the solubility of the molecule, it is important to establish that theoretical VCD computations can account for solvent effects with sufficient accuracy.
R-2-hydroxy-4-phenyl butyric acid ((R)-2H4PBA) is a carboxylic acid whose experimental VCD spectra in chloroform (CHCl3) and dimethyl sulfoxide (DMSO) show significant differences. These differences likely arise from intermolecular interactions taking place in the two solutions. In order to accurately reproduce the experimental spectra by performing VCD calculations, it is necessary to account for these interactions when setting up the calculations.
This white paper demonstrates the combined use of BioTools’ experimental VCD measurements and Schrödinger’s computational VCD predictions for the purpose of not only resolving the absolute configuration of 2H4PBA in two standard solvents, CHCl3 and DMSO, but also demonstrating possible methodology to achieve greater spectral overlap between experimental and theoretical VCD spectra.
We further demonstrate the use of available comparison and alignment algorithms such as the Pearson coefficient3 (PC) found in Schrödinger’s software and the Enantiomer Similarity Index (ESI)/Confidence level found in BioTools’ CompareVOA algorithm.4 Briefly, the Pearson coefficient is a measure of the degree of spectral overlap of the measured and calculated VCD spectra. CompareVOA calculates SNS, the sigma neighborhood similarity in percent, and the ESI, the enantiomeric similarity index (ESI or delta), is the difference between the SNS of the favored enantiomer and the SNS of the opposite (less similar) enantiomer. The larger the ESI, the higher is the confidence level of the visual assignment of AC. Both PC and ESI can be used in tandem for extra assurance.
Experimental spectra and modeling of theoretical spectra in chloroform and DMSO
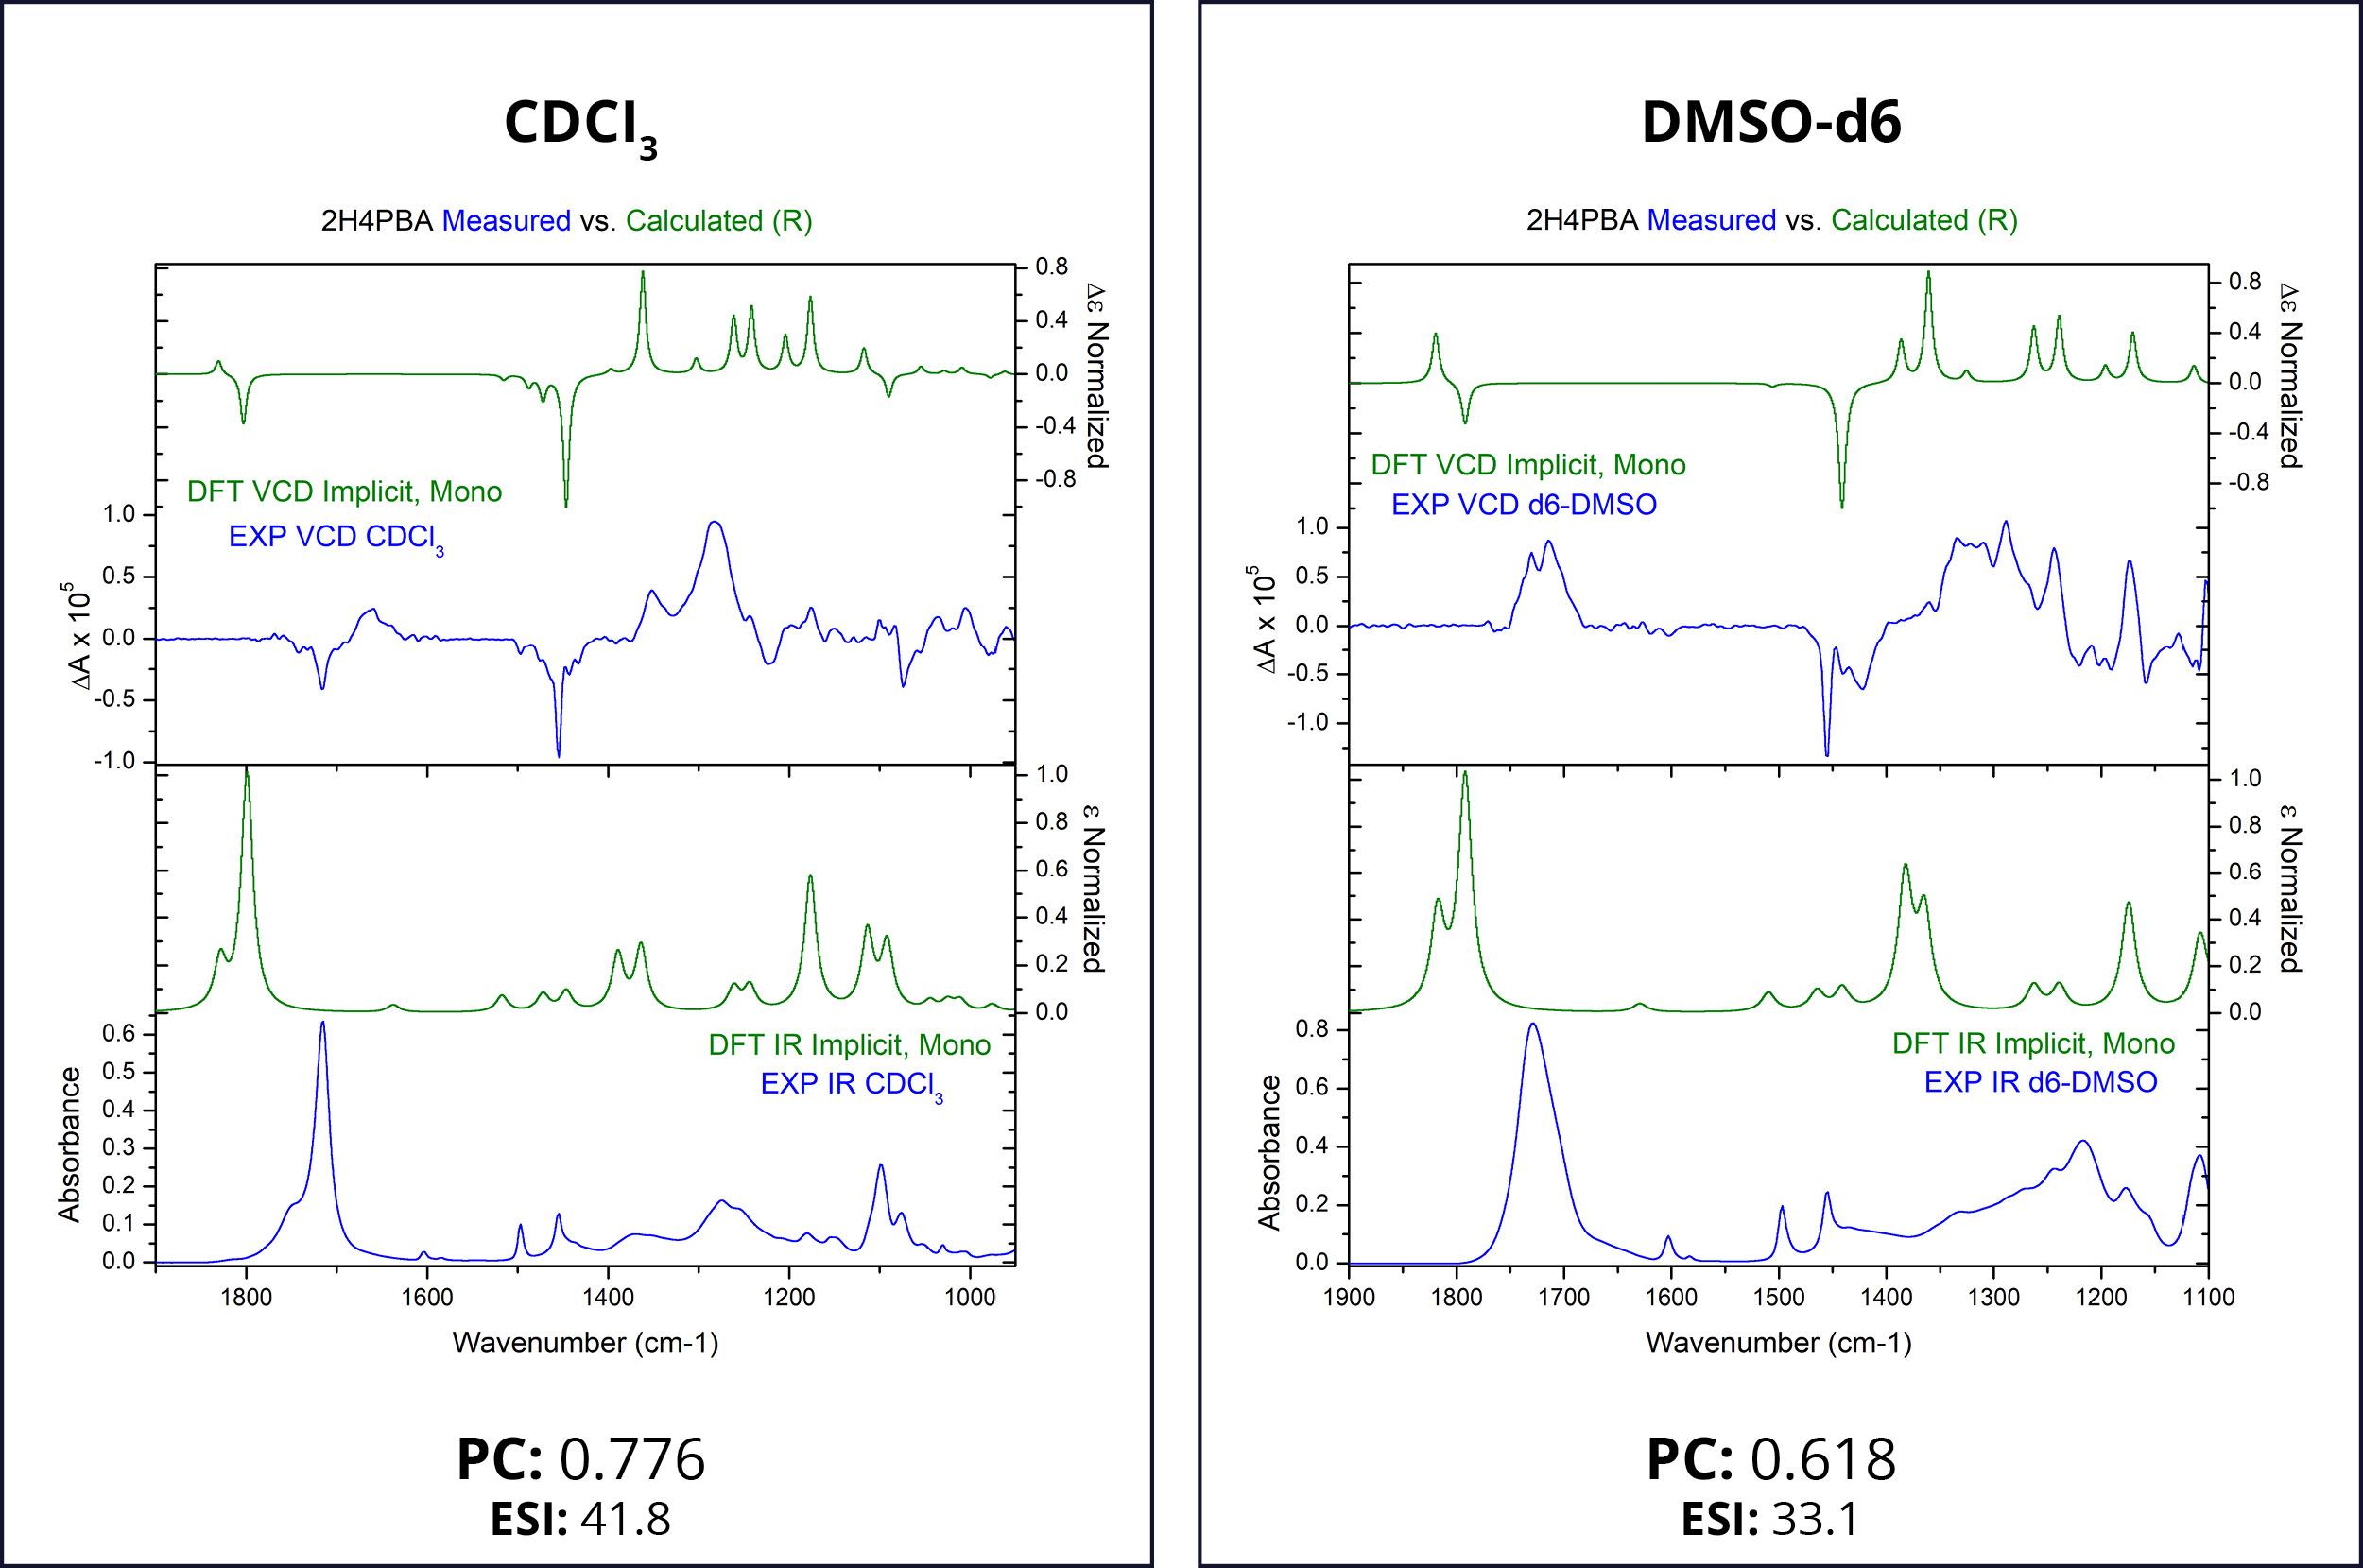
First, we attempt to model the spectra of (R)-2H4PBA in an implicit solvent. Figure 1 below shows the theoretical and experimental infrared (IR) and VCD spectra of (R)-2H4PBA. The left panel corresponds to CDCl3 whereas the right one represents DMSO-d6. Deuterated solvents are used for experimental spectra to avoid overlap of solvent IR absorption bands with those of the sample.
The theoretical VCD calculations using an implicit solvation model applied to (R)-2H4PBA yield a reasonable agreement with the experimental data for both solvents such that absolute configuration can be assigned. The Pearson coefficients (PCs) of the spectral overlap between the experimental and theoretical VCD spectra are shown below the spectra. PCs with the absolute value above 0.2 are normally sufficient to provide confidence to stereochemistry assignment,3 so the coefficients of 0.776 and 0.618 confirm that the visual assignment of the stereocenter as R is correct. The ESI4 also favors the assignment of R for the absolute configuration. Just as in the case for PCs, ESI has a lower value for the solvent DMSO-d6, compared to its value for CDCl3 . These lower values of DMSO-d6 indicate a lower level of overlap between theory and experiment.
One clearly visible qualitative disagreement between theory and experiment is the carboxyl band at around 1700 cm-1 for both solvents. The theoretical frequency is almost always shifted in this region due to lack of accounting for intramolecular or intermolecular hydrogen bonding. In the case of acid, as is here, this is most likely due to the molecule dimerization in CDCl3 involving the COOH group and solvent-solute hydrogen bonding in DMSO.
It is known that DMSO can form hydrogen bonds with some solutes, altering its conformational landscape.5 Such hydrogen bonds must be formed between 2H4PBA, which contains a hydroxyl-group, and DMSO. This is probably the main reason why the experimental VCD spectra in chloroform and DMSO are different. Theoretical spectra of 2H4PBA calculated in implicit chloroform/ DMSO solvent are not able to account for hydrogen bond formation and so, quite predictably, are very similar.
Obtaining a better spectral overlap in chloroform
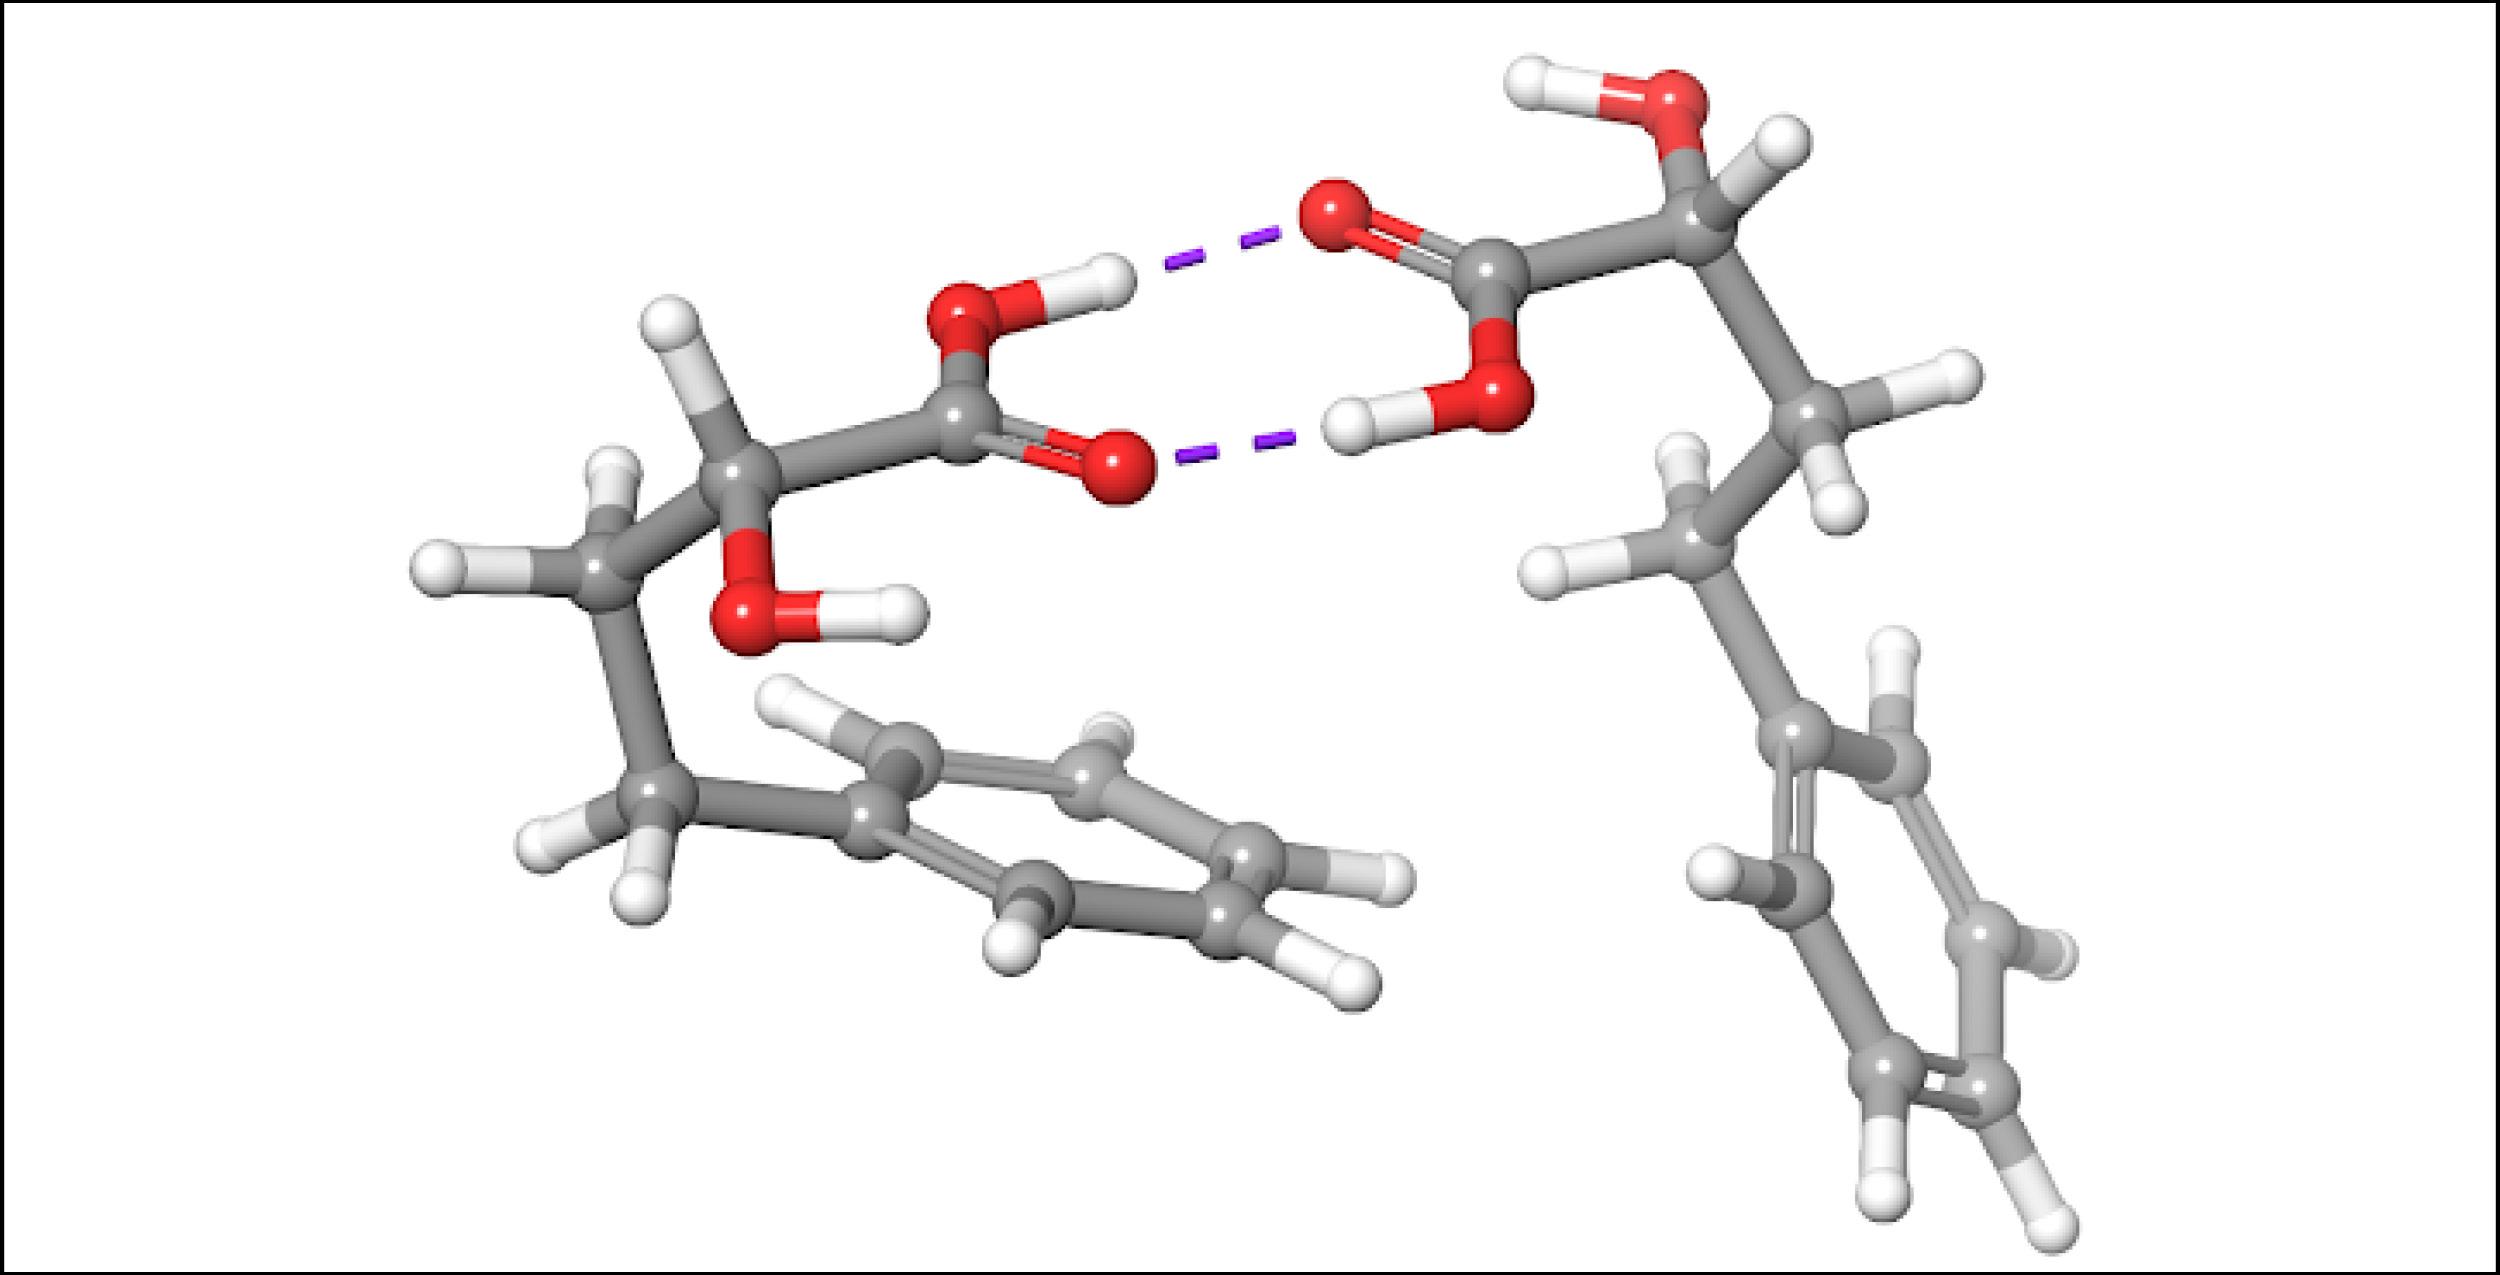
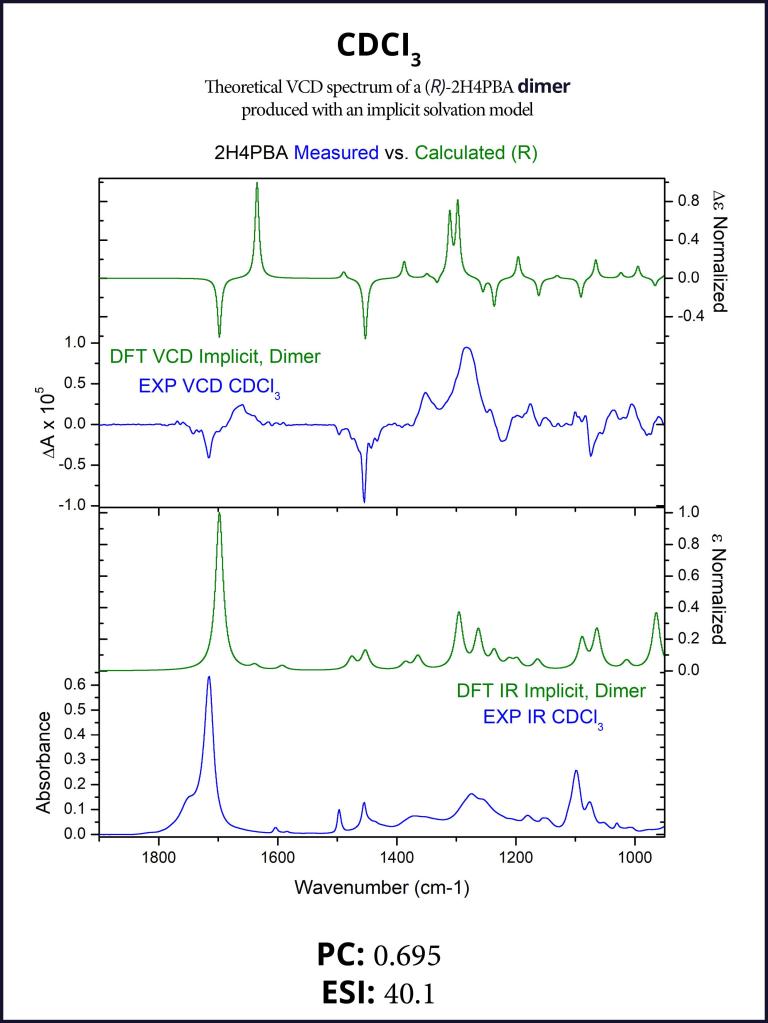
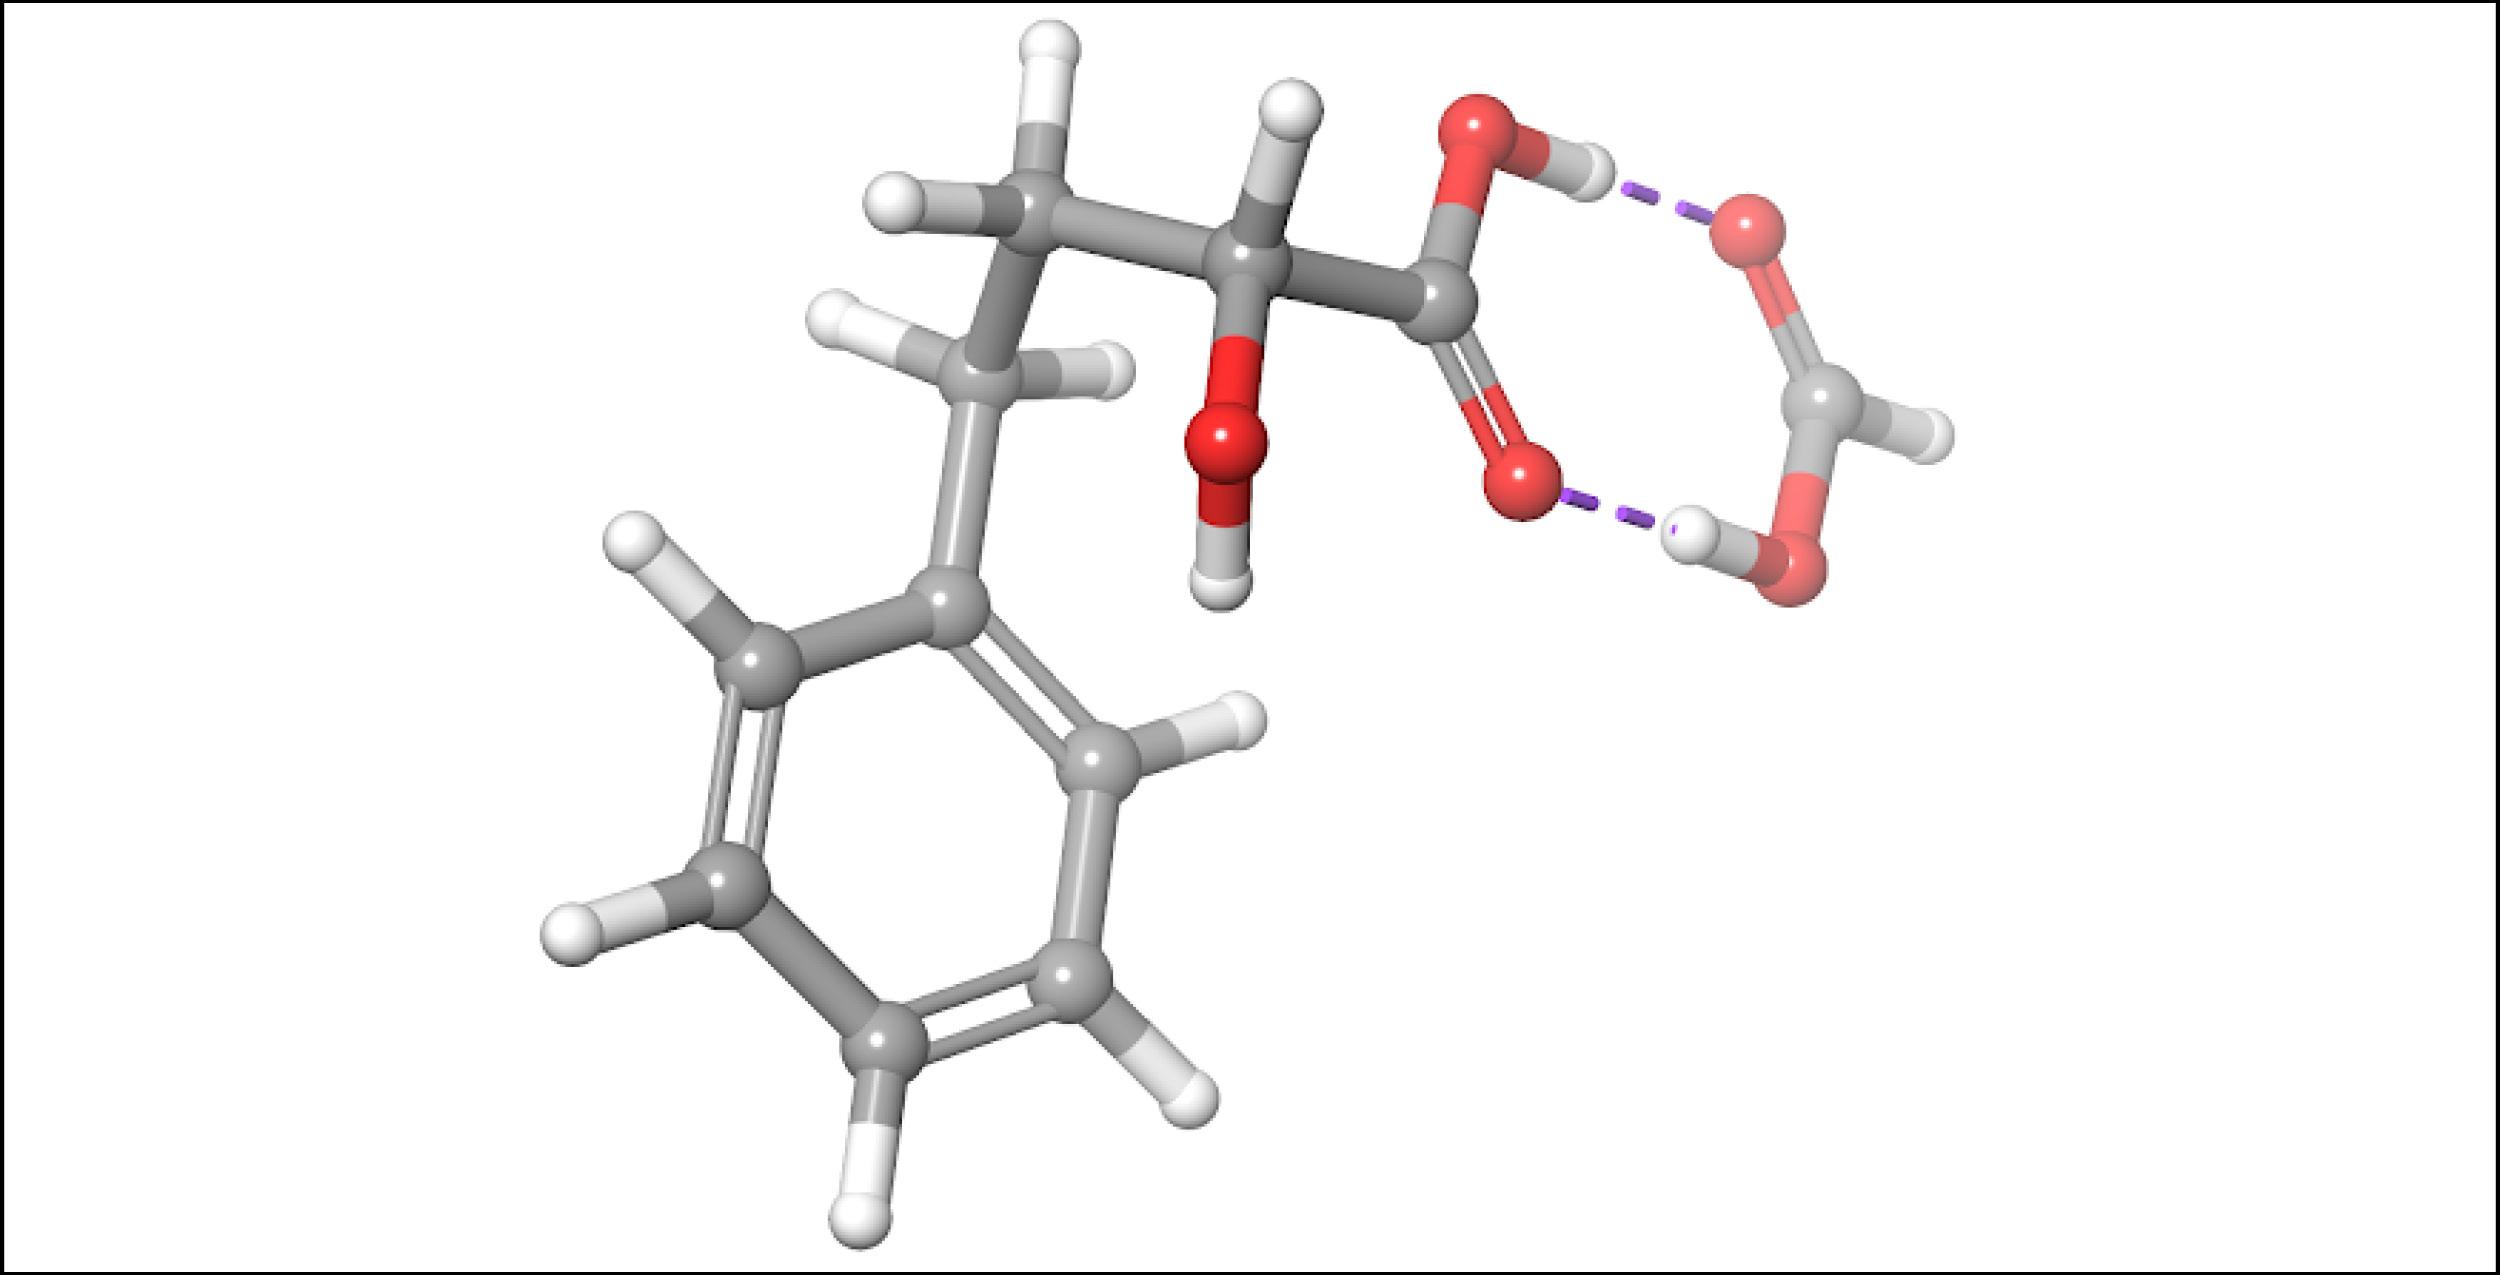
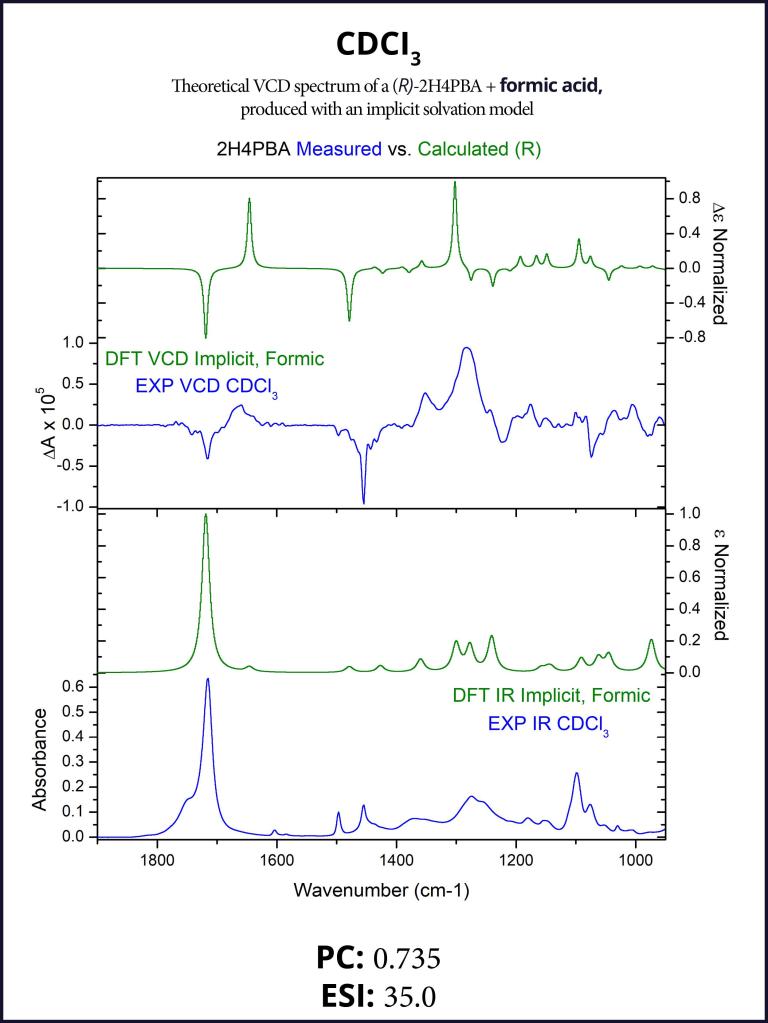
To account for the likely dimerization of (R)-2H4PBA in chloroform, we conducted a similar VCD calculation on a (R)-2H4PBA dimer (see Figure 2) using the same implicit solvent. The resulting predicted spectra show a much better visual agreement with the experimental spectra (Figure 3). VCD calculations on a dimer are significantly more computationally expensive (such a calculation including conformational search took 2 days on 8 CPUs) than those on a monomer (2 hours on 8 CPUs). One way to minimize the time expense is to ‘mimic’ modeling of the dimer as (R)-2H4PBA in a hydrogen-bonded complex with a much smaller formic acid, as shown in Figure 4. Figure 5 shows that the results of such calculation have a good agreement with the experiment. The resulting spectrum is similar in shape to that of the full (R)-2H4PBA dimer, and has the correct sign of the peaks in the region 1700-1850 cm-1. The calculation on (R)-2H4PBA + formic acid took approximately 6 hours on 8 CPUs.
Although both the dimer and the formic acid calculations improved the visual agreement and thus a confidence in assignment of the absolute configuration, it is interesting to note that both the PC and the ESI values decreased thus illustrating a very important point: PC and ESI values should only be used to confirm a visual assignment of AC. Subsequently, they provide a quantitative measure for the assignment of AC and the degree of VCD spectral agreement. PC and ESI values depend on both VCD band positions, spectral widths and intensity cancellations for neighboring VCD bands of opposite signs. It is not always possible to see whether changes in a calculation lead to improvement or reduction in the values of the PC or ESI values.
Obtaining a better spectral overlap in DMSO
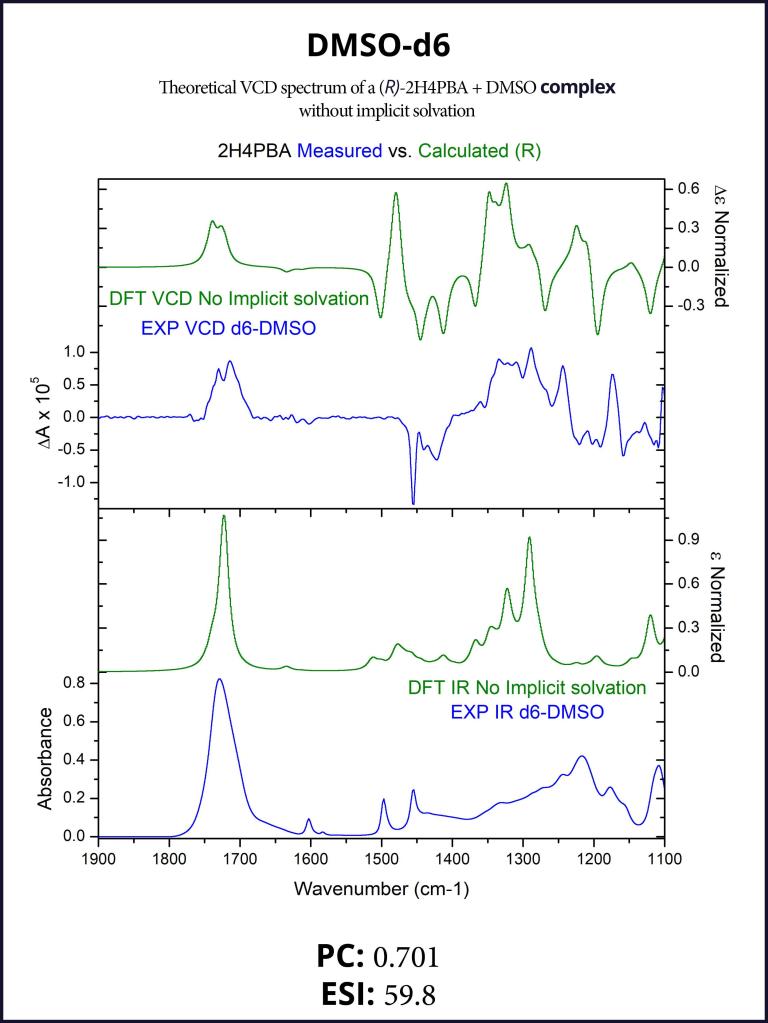
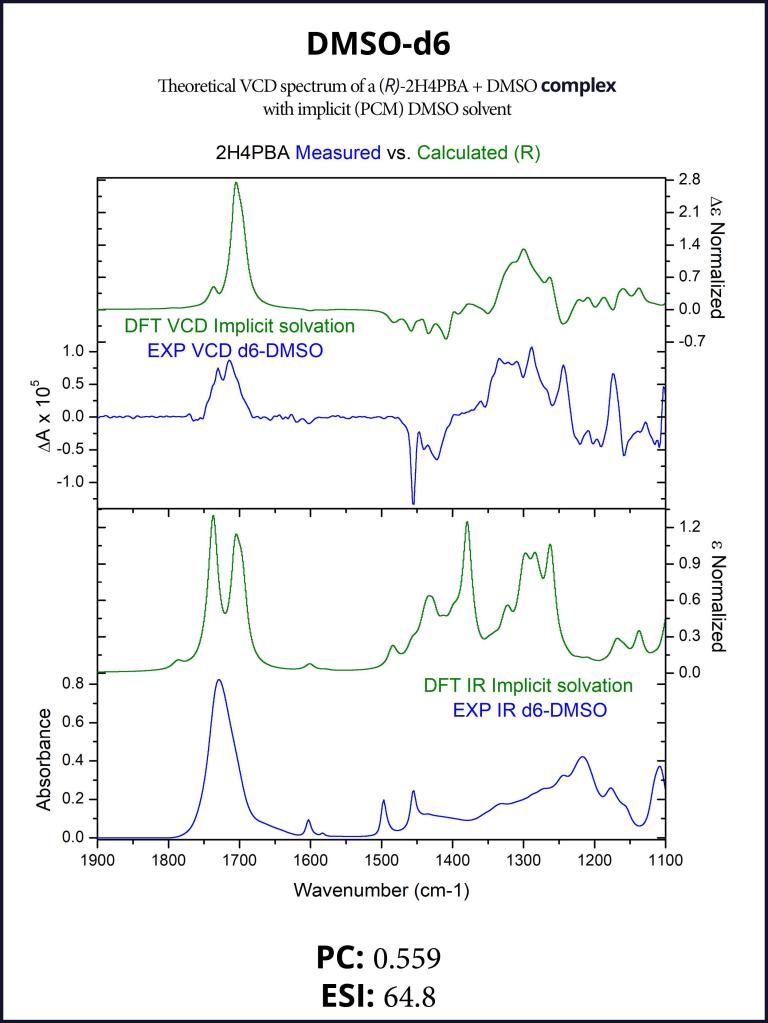
To account for the hydrogen-bonding of (R)-2H4PBA to the solvent DMSO, we set up a complex of (R)-2H4PBA with one molecule of DMSO. We performed VCD calculations on this complex in both the gas phase and with a full solvent PCM shell. The calculation involving an (R)-2H4PBA+DMSO complex with implicit DMSO solvent is consistent with the protocol used for the (R)-2H4PBA dimer in implicit CHCl3. As all the calculations in this work, the VCD calculations included conformational search on the complex.
The implicit DMSO calculations were successful in improving the simulated carboxyl band at around 1700 cm-1. The produced spectra are shown below in Figures 6-7.
Conclusions
Determination of absolute configuration can be routinely achieved by combining experimental VCD measurements (BioTools, Inc.) with theoretical VCD calculations (Schrödinger, Inc.). As solvent effects on VCD spectra can be significant it is advisable to model these effects with an implicit solvent model. For a better agreement between experimental and theoretical VCD spectra of some compounds it might be useful to go beyond standard implicit solvent calculations by:
(i) Modeling dimers of compounds prone to forming intermolecular hydrogen bonds in non-polar solvents;
(ii) Using a complex with implicit solvent molecules for a better representation of solute-solvent interactions driven by hydrogen bonding.
Experimental VCD Spectra Measurements
Approximately 8-10 mg of 2H4PBA was dissolved in ~125-250 μL and the resulting solution was transferred to a BaF2 IR cell with path length of 100 μm. Spectra were measured on BioTools’ (Jupiter, Florida) ChiralIR2X DualPEM FT-VCD spectrometer, resolution 4 cm-1, PEM maximum frequency 1400 cm-1. The samples were measured for 8 blocks of 1 hour each while purged with dry air to remove water vapor. IR spectra were processed by solvent subtraction and offset to zero at 2000 cm-1. The VCD blocks were averaged, then processed by half difference method [(E1 – E2) / 2].
Theoretical VCD Spectra Calculations
The theoretical VCD spectra were modeled with the standard computational VCD workflow by Schrödinger, Inc. A MacroModel/OPLS4 conformational search retains up to 100 conformations within 5 kcal/mol energy window. All subsequent DFT calculations are carried out with Jaguar at the B3LYP-D3/LACVP** level of theory. When implicit solvent models are requested, the geometries of the conformations are optimized with PCM (polarizable continuum model) and a final single point energy evaluation for determining Boltzmann weights is done with PBF (Poisson-Boltzmann finite elements). If no implicit solvent is requested, the geometries of the conformations are optimized in the gas phase. VCD spectra of the conformations that fit within 5 kcal/mol energy window are computed with or without implicit PCM solvent, as requested. The spectra of individual conformations are Boltzmann-averaged and then normalized to produce the final VCD spectrum. Alignment of theoretical and experimental spectra is achieved according to the algorithm described in Ref. 3.